Key Findings and Recommendations
 Key Findings
- This study has adopted unique spatially and temporally explicit methods of systems analysis to establish that alternative water cycle management embedded within existing centralised water cycle networks can offer technically, commercially and environmentally viable strategies.
- A stakeholder, review and hindcasting process was utilised to obtain data and information that allowed enhancement of an existing systems model.
- The integrated systems model was used to support an evidence based policy process.
- The enhanced systems model successfully reproduced the behaviour of regional storages, water demands and wastewater discharges. The spatial robustness of the systems model was verified for generation of water demands and wastewater discharges throughout Greater Melbourne. Costs and greenhouse gas emissions in the systems model were also successfully verified against all available data.
- The systems model provided similar or more conservative results for the impacts of expected climate change than estimates provided by CSIRO and IPCC.
- More than 40 discrete combinations of Options and Scenarios were tested that provided a rich data set for understanding the future challenges and opportunities for Greater Melbourne’s water cycle.
- The existing system (BAU) is critically dependent on (or sensitive to) variations in climate and population.
- The expected increases and accumulation of wastewater and stormwater in water cycle networks are significant challenges for Greater Melbourne to 2050.
- This investigation has found that up to three additional augmentations of the regional water supply system are required for BAU to 2050 in response to potential climate change.
- The building scale Options (BASIX and BASIX1) substantially mitigate the challenges of variable population and climate.
- The precinct scale Options (ULT and ULT1) almost eliminate the challenges of variable population and climate.
- Alternative Options can generate substantial reductions in water demand, wastewater discharges and stormwater runoff.
- Alternative Options can provide significant reductions in the cost of providing water and wastewater services that include reduced transfer costs of providing water and sewage services.
- The full costs (and benefits) of projects for water cycle management are not currently considered. This is likely to create bias in decision making processes towards augmentation using large scale infrastructure.
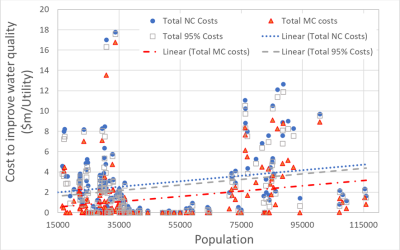
- The variances and inconsistencies in data highlighted in this investigation indicate that it has been previously difficult to develop accurate spatial understanding of the performance of Greater Melbourne’s water cycle. Thus it is unlikely that the actual costs of providing services to discrete spatial locations throughout Greater Melbourne have been considered.
- One of the most significant outcomes of the MAC process was the large number of individuals who demonstrated significant good will and willingness to generate change across the sector.
Key Recommendations
- Implement “whole of Melbourne” minimum objectives for water cycle management that include minimum annual reductions in demand for mains water, wastewater discharges and stormwater runoff of 80%, 50% and 30% respectively. These objectives should be combined with spatially relevant building scale targets that include minimum annual reductions in demands for mains water, wastewater discharges and stormwater runoff of 50%, 30% and 20% respectively.
- Minimise the total distances involved in the transfer of water and wastewater throughout Greater Melbourne in water cycle planning and design of infrastructure.
- Eliminate “lumpy” expenditure for large scale centralised infrastructure wherever possible. There is significant value in avoiding investment in large scale infrastructure by utilising timely investment in smaller scale local infrastructure as required.
- Water cycle planning and associated decision making should be derived from the integrated systems analysis methods utilised for this investigation to provide better understanding of the spatial variance and complexity of the water cycle throughout Greater Melbourne.
- Implement design guidelines that are underpinned by the latest knowledge, understanding and integrated systems processes. The new guidelines must consider the impacts of multiple water sources, water efficiency and local variability on the design of infrastructure.
- Implement a high quality monitoring and data management system for the entire Greater Melbourne water, sewage and stormwater networks. This system should be implemented and managed independently and in partnership with all water authorities to ensure consistency. The “whole of Melbourne” monitoring and information management systems should also include observations of stormwater runoff volumes and quality.
- Implement a competitive process for management of water resources throughout Greater Melbourne. An essential element of this process is the structural seperation of planning, approval and operational processes involved in delivering water cycle services. At a minimum this will involve assigning water cycle planning and approval functions to an independent authority.
- Provide open, transparent, and freely accessible information about the performance of water cycle systems throughout Greater Melbourne to all stakeholders and the community. This information should be managed by an independent authority and be available in a common location and format.
Introduction
The purpose of this investigation was to provide systems analysis of the water cycle for Greater Melbourne and advice in support of the Ministerial Advisory Council (MAC). This process aimed to generate discussion and deeper understanding of the detailed transactions that drive water cycle management throughout the region.
This alternative view was used as a basis for the implementation of the Living Melbourne, Living Victoria policy and this report supports the recommendations in the MAC’s final Stage II report.
The Ministerial Advisory Council (MAC) commissioned Dr Peter Coombes and Bonacci Water to provide “Modelling in support of the Living Victoria Ministerial Advisory Council work program” using the Greater Melbourne Systems Model utilised during Stage I of the MAC process. This process involved a range of key objectives including:
- Assist in deepening the understanding of the MAC about the Stage I model and outputs.
- Validate and strengthen the model and outputs for the MAC.
- Provide continuing support for investigations and policy processes undertaken by the MAC.
An integrated systems approach was employed by this study to analyse the performance of integrated water cycle management Options throughout the Greater Melbourne region. Options were determined to generate understanding of the response of the water cycle systems within Greater Melbourne to alternative strategies and to subsequently inform decision making for water policy.
This unique analysis was dependent on detailed local inputs throughout the system, such as demographic profiles and human behaviour, and linked systems that accounts for water supply, sewage, stormwater and environmental considerations. The systems analysis was built on local scale (the people) inputs (a “bottom up” process) rather than traditional analysis of metropolitan water resources that commences with regional scale assumptions (a “top down” process).
This project has utilised the powerful framework for detailed systems analysis of the Melbourne region that has been developed over a long period of continuous investigation. Three decades of research, two separate investigations (the previous investigation commenced in 2006) and a year of dedicated analysis have enabled a robust analysis.
Options and Scenarios
Options
Four alternative options were examined for water cycle management within Greater Melbourne. The performance of each Option was compared to the performance of the Business as Usual (BAU) Option.
The purpose of establishing Options was to facilitate testing of the physical, technical and commercial performance of the system without the influence of opinions, perceptions and agenda. Defining a base case (Business as Usual) and alternative Options enable the testing, comparison and understanding of the behaviour of the Greater Melbourne system. This study did not seek to pick an endpoint or to provide a detailed design of the Options. It provides useful insight into systems behaviour that can inform decision making.
These Options were established to test, compare and contrast a range of alternative future states. Note that each Option is also subjected to a range of naturally variable climate scenarios. The alternative Options are described in Table E1.
Table E1: Summary of Options
| Option | Description |
| 0 Business as Usual (BAU) | Management of water, wastewater and stormwater using centralised infrastructure. Future water security and wastewater treatment is provided by regional infrastructure (such as desalination). Population growth requires expansion of existing networks. |
| 1 (BASIX) | Water efficient appliances (Green Star 6 standard) and water efficient gardens in all new and redeveloped buildings. Rainwater harvesting for toilet, laundry and outdoor uses replacing requirement for On-Site Detention for stormwater management. |
| 2 (BASIX1) | Water efficient appliances – Green Star 6 standard. Rainwater harvesting for toilet, laundry and outdoor uses replacing on-site detention for stormwater management. |
| 3 (ULT) | Precinct scale wastewater treatment and reuse for toilet and outdoor uses. Precinct scale stormwater harvesting for potable water supply. Stormwater is treated and injected into the water supply network. Water efficient appliances and gardens in all new and redeveloped dwellings. |
| 4 (ULT1) | Precinct scale wastewater treatment and reuse for toilet and outdoor uses. Local rainwater harvesting for laundry and hot water use. Mains water supply for kitchen and drinking purposes. Water efficient appliances and gardens in all new and redeveloped dwellings. |
Scenarios
Scenarios describe the potential changes in qualitative drivers that may influence the behaviour of the system. These qualitative drivers create behaviours that may be experienced by any Option. The consequent plausible alternative futures test the viability of the Options. The Scenarios applied to each of the Options for water cycle management throughout Greater Melbourne examined in this study are summarised in Table E2.
Table E2: Summary of Scenarios
| Scenario | Description |
| Low Emissions Climate Change (LE) | Lower bounds of high emissions projections by IPCC represented by a 0.025°C incremental annual change in average maximum temperature. |
| High Emissions Climate Change (HE) | Higher bounds of high emissions projections by IPCC represented by a 0.05°C incremental annual change in average maximum temperature. |
| Greenfield Growth (GF) | All urban growth occurs as Greenfield development at the fringes of Greater Melbourne where development currently does not exist. |
| Infill Growth (IF) | All urban growth occurs as infill development of existing inner urban areas of Greater Melbourne. |
| Low Population Growth (0%) | Annual average population growth remains static (0%) across Greater Melbourne from 2011–2050. |
| High Population Growth (2%) | Annual average population growth of 2% across Greater Melbourne from 2011–2050. |
| Economic Structural Change (EC) | Structural change in the economy results in the closure of the majority of Greater Melbourne’s heavy industry and manufacturing. This results in reduced commercial and industrial water demand. |
Methodology
This study employed an integrated systems approach to analysing the performance of alternative water cycle management Options for Greater Melbourne. Options were determined to generate understanding of the response of the water cycle systems throughout Greater Melbourne to alternative strategies.
This unique analysis is dependent on detailed inputs, such as demographic profiles, and linked systems that accounts for water supply, sewage, stormwater and environmental considerations.
The systems analysis was constructed from the basic elements (the lot scale inputs) that drive system behaviours and account for first principles transactions within the system to allow simulation of spatial performance of the system. Biophysical systems in the region were constructed using three basic components:
- Sources – Regional and local water sources, catchments and waterways
- Flux – transport and treatment of water, sewage and stormwater throughout the region
- Sinks – Stormwater runoff and wastewater disposal to waterways
The analysis is anchored by a regional framework of key trunk infrastructure, demand nodes, discharge points, waterways and regional sources of water in the systems model.
Major water distribution, stormwater, sewage, demographic, climate and topographic zones are combined in this framework. This process compiles inputs from a wide range of commonly utilised analysis tools, including for local water demands and water balances and hydrology. Key inputs to this framework include:
- Demographic data from the Australia Bureau of Statistics and State Government departments including the Department of Planning and Community Development (DPCD)
- Climate data from the Bureau of Meteorology (BOM) and streamflow data from the Victorian Data Warehouse and MWC.
- Water and sewage flows sourced from MWC, CWW, SEW and YVW.
- Local and cluster scale inputs simulated in the PURRS model at 6 minute timesteps using long climate records sourced from the BOM.
- Urban areas and LGAs analysed using a range of models including PURRS and MUSIC. These smaller scale systems are also analysed in more detailed WATHNET models.
- The biophysical and scale transition model compiles inputs from PURRS into zones based on statistical local areas and calibrates to observed data from water and sewage catchments.
- The Wathnet model was used to collate and simulate all inputs across the entire region
This framework incorporates the movement of water throughout the region and connectivity to the water supply headworks system. Similarly, this framework includes the movement of sewage throughout the region and connectivity with discharge points or reuse systems.
Details of the analysis, extractions from the data and modelling process have been provided throughout this report to assist with understanding the systems processes used in this study.
Household water consumption for the period 2005 to 2006 was selected in this study as representing base water consumption for the region during a period relatively free of water restrictions. These water demands were then modified by a range of processes including adoption of water efficient appliances in some houses, connection to wastewater reuse systems and changes in demographics. The economic analysis was based on the 2009/10 financial period.
Results
Most parameters relevant to water cycle management are subject to significant spatial variation throughout Greater Melbourne. These include climate, water demands, wastewater generation, stormwater runoff, socio-economic and demographic profiles, and the cost of providing water and wastewater services.
The water cycle for Melbourne cannot be described by homogenous parameters based on a single location or even regional averages. Similarly, this study has shown that the existing performance of the Greater Melbourne system or its response to policy changes cannot be based on single parameters or solutions. In particular, the existing system (BAU) is critically dependent on (or sensitive to) variations in climate and population.
The expected increases and accumulation of wastewater and stormwater in water cycle networks are significant challenges for Greater Melbourne. This investigation has found that up to three additional augmentations of the regional water supply system may be required. A summary of requirements for augmentation are presented in Table E3.
Table E3: Summary of requirements for augmentation of regional water supply
| Scenario |
Year of regional augmentation versus Option |
||||
|
BAU |
BASIX |
BASIX1 |
ULT |
ULT1 |
|
| HE |
2014, 2026, 2045 |
2023, 2039 |
2015, 2023, 2047 |
No |
2045 |
| LE |
2015, 2032 |
2034, 2045 |
2031, 2045 |
No |
2038 |
| Two |
2042 |
No |
2042 |
No |
No |
Table E3 demonstrate that alternative Options for water cycle management provide significant improvements in the security of Greater Melbourne’s water supply and that the climate change and population growth is likely to have a significant impact of security of water supplies.
The ULT Option that includes multiple sources of water and efficient use of water eliminate requirement to augment regional water supply.
It is noteworthy that the high emissions (HE) and low emissions (LE) generate requirement for additional regional water sources for all Options expect the ULT Option. In addition, the BAU Option includes up to three augmentations and requires continuous operation of desalination plants which the alternative Options require use of desalination when total water storage in regional dams are drawn down below 65%. In addition, the alternative Options BASIX, ULT and ULT1 eliminate the requirement for additional water supplies. The results of this study are summarised in Table E4.
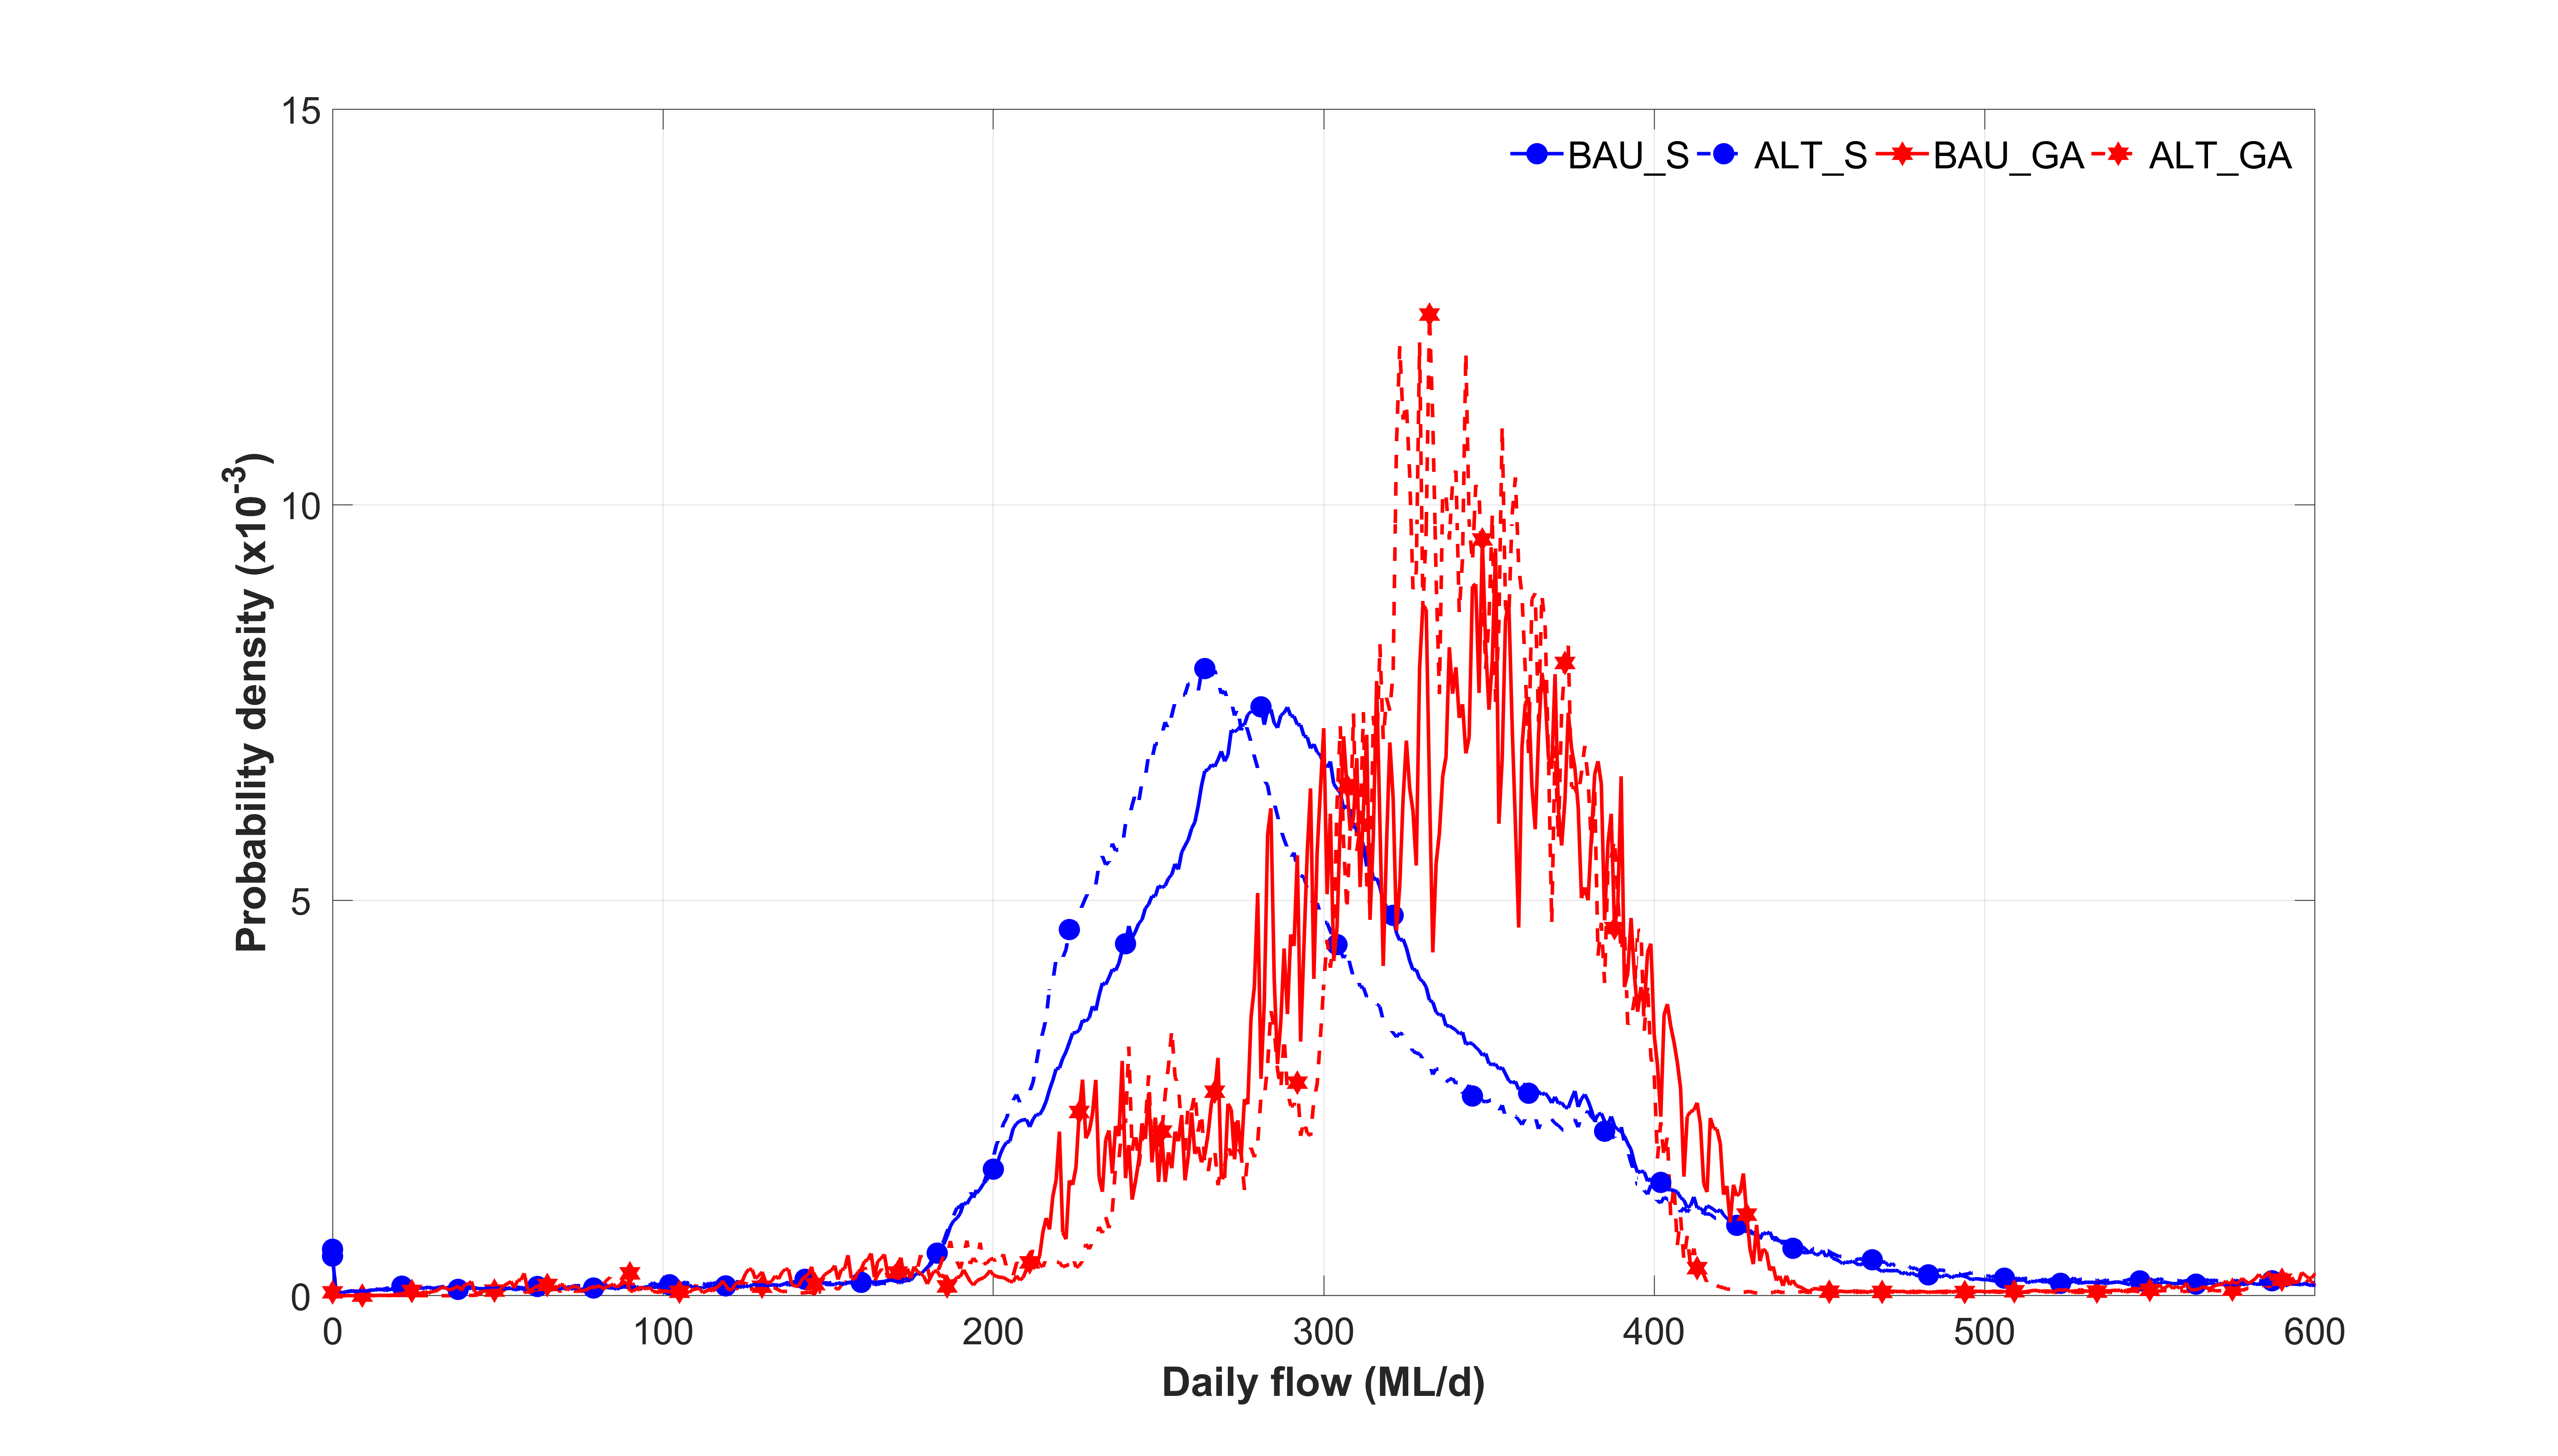
Impact of rainwater and stormwater harvesting on the water cycle
Table E4: Summary of the systems analysis (decreases relative to BAU)
| Criteria |
BAU |
BASIX |
BASIX1 |
ULT |
ULT1 |
| Mains Water Demand 2050 (GL/annum) |
522
|
378 28% decrease |
396 24% decrease |
286 45% decrease |
321 38% decrease |
| Cumulative mains water demand 2010-2050 (GL) |
19,210 |
15,390 20% reduction |
15,926 17% reduction |
14,010 27% reduction |
15,342 20% reduction |
| Augmentation of water supply |
YES – up to 3 (HE ) 2014 – 50 GL 2026 – 100 GL 2045 – 50 GL |
YES – up to 2 (HE) 2023 – 50 GL 2039 – 100GL |
YES – up to 3 (HE) 2015 – 50 GL 2023 – 50 GL 2047 – 50 GL |
None required |
YES – 1 (HE) 2045 – 50 GL
|
| Reliant on desalination? |
YES |
YES |
YES |
NO |
NO |
| Wastewater Discharge 2050 (GL/annum) |
552
|
466 15% decrease |
490 11% decrease |
378 32% decrease |
378 32% decrease |
| Cumulative wastewater discharges 2010-2050 (GL) |
19,625 |
17,383 11% reduction |
17,972 8% reduction |
15,477 21% reduction |
16,191 17% reduction |
| Stormwater Runoff 2050(GL/annum) |
527
|
483 8% decrease |
478 9% decrease |
306 42% decrease |
467 11% decrease |
| Cumulative stormwater runoff 2010-2050 (GL) |
17,487 |
15,383 12% reduction |
15,171 13% reduction |
14,919 15% reduction |
15,355 12% reduction |
| Greenhouse Gas emissions2050 (kT CO2e/yr) |
1,928
|
1,513 40% decrease |
1,215 37% decrease |
1,036 46% decrease |
1,095 43% decrease |
| Cost of Carbon 2050 ($M) |
48.2 |
28.8 40% reduction |
30.4 37% reduction |
25.9 46% reduction |
27.4 43% reduction |
| Water NPC ($B) |
23.9 |
22.7 5% decrease |
23.2 3% decrease |
23.2 3% decrease |
23.5 2% decrease |
| Wastewater NPC ($B) |
13 |
11.6 11% decrease |
11.7 10% decrease |
11.6 11% decrease |
11.7 10% decrease |
| Stormwater NPC: Infrastructure, Flooding and Nutrients ($B) |
7.35
|
6.9 6% decrease |
6.83 |
5.37 27% decrease |
6.53 11% decrease |
| Nutrients 2050 (tonnes/annum) |
1,110 |
1,020 8% decrease |
1,002 10% decrease |
640 42% decrease |
882 20% decrease |
Table E4 reveals the key findings of this study that include:
- Population growth is a key driver of future water demands, wastewater generation and stormwater discharges. The costs of incorrectly predicting population growth has critical implications for the State of Victoria.
- Future variations in climate regimes will create substantial variations in water demands and availability of water. Higher temperatures drive greater water demands and this concurrently reduces rainfall and streamflow (that drives centralised supply).
- The debate as to whether future urban growth should occur as Greenfield or Infill development does not appear to be significant. These Options do not have significantly different impacts on the system.
- A change in the structure of the Victorian economy could have a significant impact on water demands, security of water supplies and the spatial response of the system.
- Mistaken predictions of water cycle impacts and associated requirement for large scale infrastructure may result in stranded assets – large infrastructure without the demand to pay for it.
- Alternative Options consistently deliver significant reductions in water demands, wastewater generation and stormwater discharges:
- The ULT Option generates the greatest reductions in water cycle impacts in comparison to BAU.
- The other alternative Options generate significant (but diminished when compared to ULT) reductions in demands on the water cycle for Greater Melbourne.
- Alternative Options also deliver the greatest resilience and flexibility when subject to future variability:
- The ULT Option delivers the greatest resilience and flexibility in comparison to BAU due to the use of multiple water sources in combination with water efficiency.
- The other alternative Options also generate significant (but diminished when compared to ULT) resilience and flexibility.
- Water efficient gardens and public open space are an important component of overall water efficiency for Greater Melbourne. This initiative delivers tangible benefits including reduced water demands and avoids augmentation of infrastructure. Water efficient gardens should form part of future water policies.
- The omission of stormwater harvesting for injection into the mains system for potable use from the ULT Option “leaves significant value on the table”. This lost value includes the ability to affect substantial reduction in mains potable demands, improved water security and reduced requirement of regional augmentation.
- Perceived problems that originate from concerns about institutional and governance issues need to be challenged and overcome. Failure to resolve these issues stand in the way of substantial benefits to society.
- Alternative Options generate significant economic and financial benefits. The ULT Option generates the most significant reductions in costs and the other alternatives generate significant (but slightly reduced) benefits, including:
- Reduce the cumulative total costs of the system by up to $30 B over 40 years
- This equates to 1% to 2% of State’s total expenditure every year to 2050 or 65% of Victoria’s 2011-12 budgeted expenditure.
- This value is equivalent to 30 hospitals or 60 new prisons or 10 new Freeways or 6 Regional Rail Links
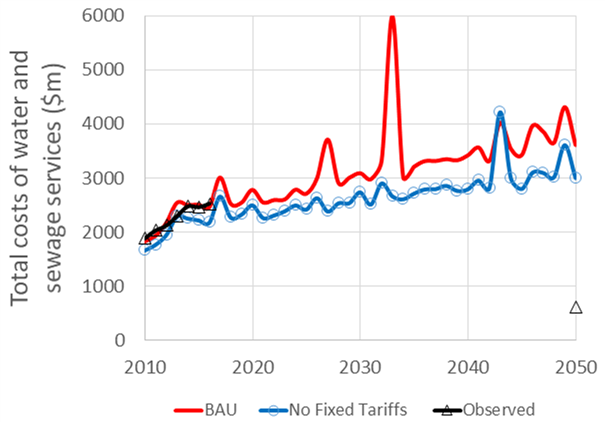
- Total water cycle management costs vary significantly in response to different futures. Substantial reductions in total costs are generated by the low growth and economic structural change Scenarios. In contrast, the high growth and climate change Scenarios produce considerable increases in total costs.
- The ULT Option generates the greatest resilience to variations in costs resulting from alternative future states and the other alternative Options generate diminished but still significant resilience.
- The alternative Options generate a range of additional financial, social and environmental benefits, including:
- Up to a 20% (8,246 tonnes) decrease in nitrogen loads entering waterways
- Significant reduction in the costs of stormwater infrastructure (up to a 13% decrease), the flooding (up to a 17% decrease) and management of nutrients (up to a 17% decrease)
- Up to a 30% (34,171 kT) reduction in cumulative GHG emissions. This result challenges the perception that alternative Options consume more energy than BAU. It also highlights the importance of holistic and integrated systems analysis
This study used detailed systems analysis to compare the spatial capacity and potential spatial performance for each Option. These are defined as follows:
- Capacity: the definition of the potential of each Option at each building or household or precinct throughout Greater Melbourne
- Performance: the definition of the behaviour of each Option within the planning horizon that is modified by population growth, renovation rates, demographic processes and the legacy of existing infrastructure and policies
The study found that buildings and households across Melbourne have the capacity to achieve significant reductions in water demand, wastewater discharges and stormwater runoff. The use of a spatially explicit modelling framework in this study was able to show that this capacity varies across Melbourne. All Options provide reasonably consistent capacity outcomes that result in substantial reductions in water demands, wastewater discharge and stormwater runoff for all locations across Greater Melbourne.
The spatial variation in performance of Options is driven by a multitude of factors including rainfall, proportion of residential and non-residential buildings, the age of suburbs, the condition of existing infrastructure and the distance to and from water supply sources and wastewater treatment facilities:
- The ULT Option achieves consistently greater capacity and higher performance for all measured indicators for all of Greater Melbourne.
- Other alternative Options generate significant (but slightly diminished) capacity and performance for Greater Melbourne.
Conclusions
The Options considered in this study provide the following key outcomes:
- the existing system (BAU) is critically dependent on (or sensitive to) variations in climate and population.
- The building scale Options (referred to in this study as BASIX and BASIX1) substantially mitigate the challenges of variable population and climate
- The precinct scale Options (referred to in this study as ULT and ULT1) almost eliminate the challenges of variable population and climate
- The alternative Options generate reductions in
- water demand, wastewater generation and stormwater runoff
- the cost of providing water and wastewater services, and
- the transfer costs of providing water and sewage services
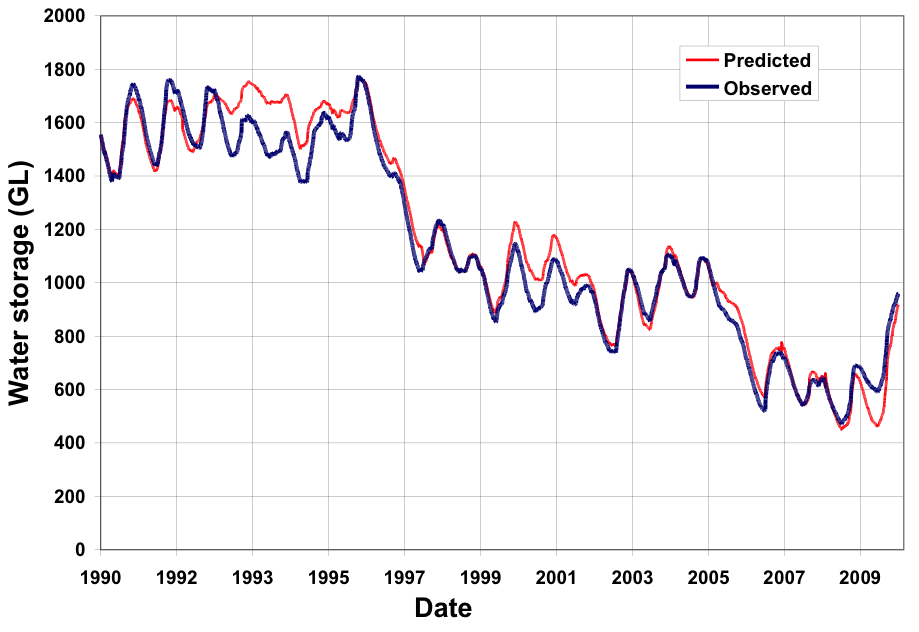
Verification of the Systems Framework using sequences of predicted and observed total dam storage