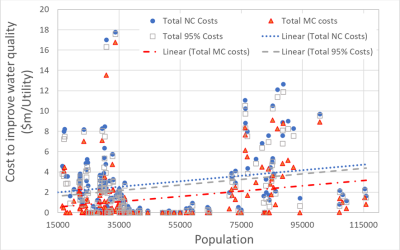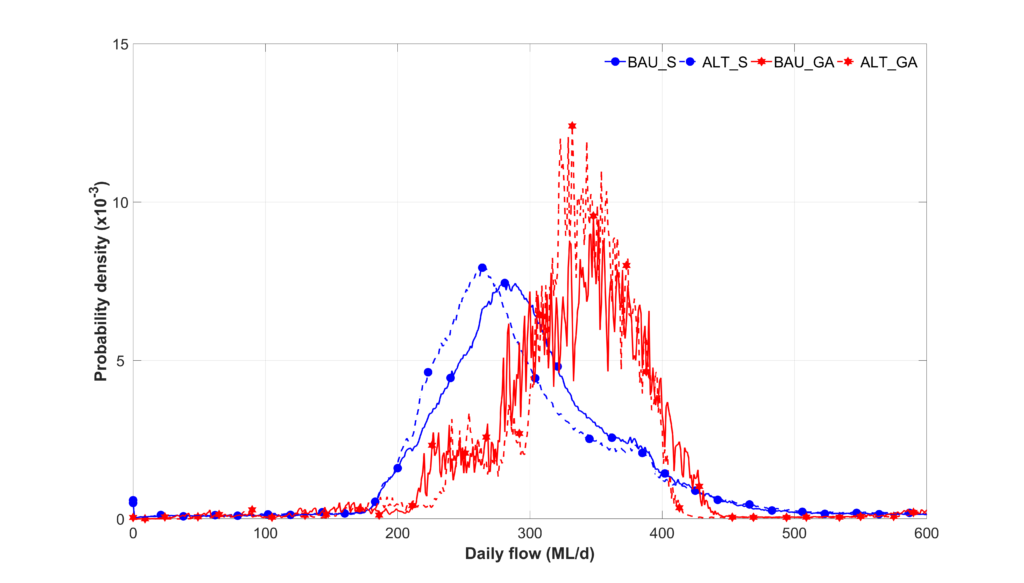
Impact of average assumptions on water flows in distribution networks showing over-estimation of flows and an illusion of no changes in flows from alternative water strategies (red = average; blue = detailed systems analysis)
Making of the paper:
Planning resilient water resources and communities: the need for a bottom up systems approach
Michael E Barry and Peter J Coombes
Impact of Averages on Water Modelling
This paper was awarded the GN Alexander Medal by the Engineers Australia National Committee on Water Engineering. This Medal is usually awarded every 18 months for the best paper in hydrology and/or water resources published in an Engineers Australia publication.
This article presents an overview of the processes leading to making this journal paper.
The question
Urban areas are complex systems that involve dynamic linkages and feedback processes across demographics, socio-economics, urban form, weather and a multitude of parameters. Numerical models are needed and employed to understand the performance of water resources, ecosystems and economics in urban areas.
Analysis of water resources commonly employs understandable deterministic processes that utilise temporal and spatial averages that are based on large centralised scales (such as an average household or per-capita water use multiplied by the number of dwellings or people in a city, respectively) and lengthy time intervals (for example: monthly).
Does the traditional use of centralised average demand inputs to models used to analyse water resources change our understanding of water security, requirement for infrastructure, performance of alternative strategies and assessment of government policy.
The Journey
The “bottom up” Systems Framework was created during PhD research (1998 – 2002) by Peter Coombes to understand the impacts of distributed interventions on regional water cycle systems and economics.
Since 2004, Michael Barry and Peter Coombes collaborated on application of the Systems Framework to development of strategy and government policy for water resources. The journey to understand the impacts of average assumptions on assessment of water resources commenced during 2010. The systems framework approach has evolved over the last two decades by utilising emerging computing power that permits bottom up processes underpinned by big data.
Evolving applied science
The Systems Framework approach required development of behavioural models of water uses at households and other land uses that were driven by Big Data inputs (such as weather, demographics, billing data and socio-economics) at fine spatial and temporal scales.
These systems models were constructed in hierarchical frameworks across multiple scales from land use to neighbourhood to suburb to region. They incorporated all available data and information at each scale including water, sewage and stormwater infrastructure, and waterways. Inclusion of feedback loops throughout the framework of behavioural drivers created a “self organising” systems analysis. For example, water restrictions or changes in prices at a regional scale influences local behaviours. This impacts across different scales across a city to produce different regional responses.
Development of these Systems Framework methods over two decades included discoveries in systems thinking from Jay Forrester and Donella Meadows, natural capital from Paul Hawkin and economic processes by John Nash and Joseph Stiglitz.
Meadows final publication in 2008 highlighted a need for bottom up, hierarchical, self-organising systems frameworks to understand future challenges and policies to intervene in an increasingly complex world. This was consistent with our Systems Framework discoveries.
Bottom up systems analysis
The Systems Framework includes the spatial detail and behaviors of households and land uses. This structure permitted an extension of investigations into the Sydney and Melbourne water resources systems to evaluate the impacts of using average water demands in models. The analysis commenced with detailed spatial and temporal water demand behaviors generated by Systems Framework. These demands were then progressively averaged into local demands based on:
- local government average demands with monthly temporal patterns
- Local government average demands
- regional average demand
The impact of these different average assumptions were assessed against impacts on water security, flows in distribution networks and assessment of an alternative water strategy that includes additional distributed water efficiency and rainwater harvesting.
Overview of Results
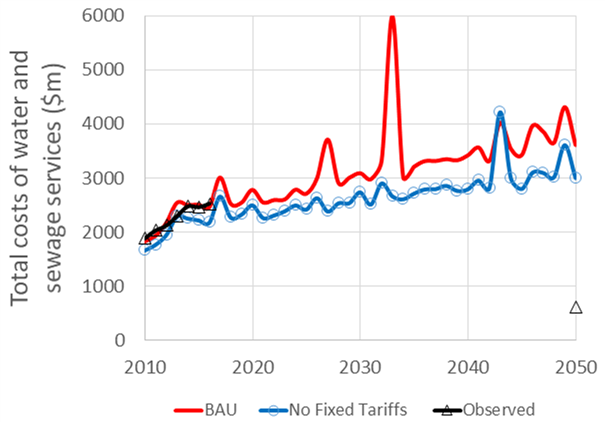
This investigation has demonstrated the problematic nature of using average water demands. This includes conceptual difficulties in calculating an average from non-normal distributions through to the consequences for model predictive capability. For example the following Figure shows that use of global average water demands (BAU_GA) over-estimates the water security of the Melbourne system when compared to the use of fully resolved local water use behaviors in the Systems Framework (BAU_S).
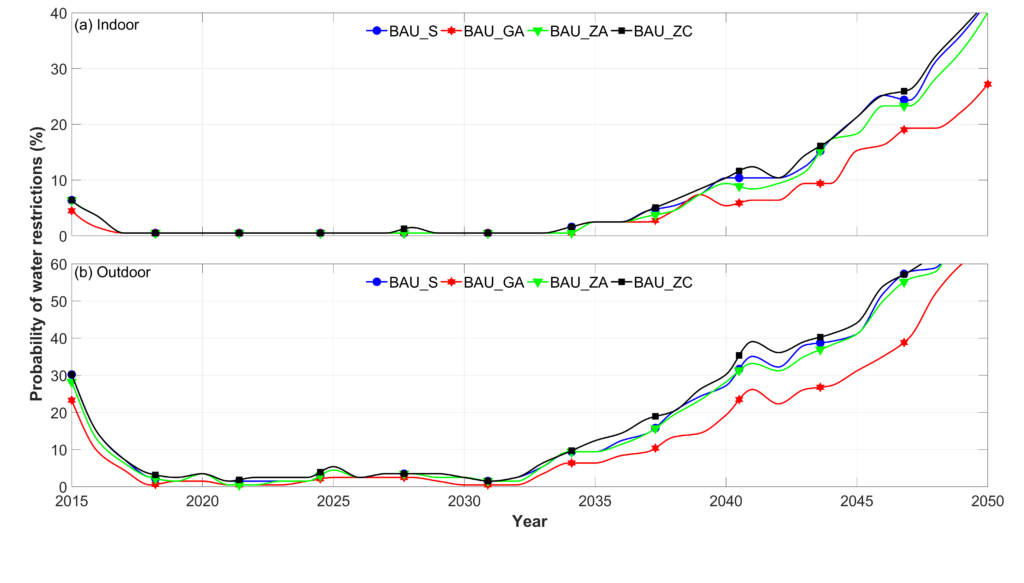
Impact of average assumptions on water security in Melbourne
In contrast, average assumptions under-estimated water security of the Sydney system. The following Figure shows that average assumptions over-estimates the magnitude and frequency of flows from the alternative water strategy (increased water efficiency and rainwater harvesting) in comparison to the fully resolved systems analysis (ALT_S).
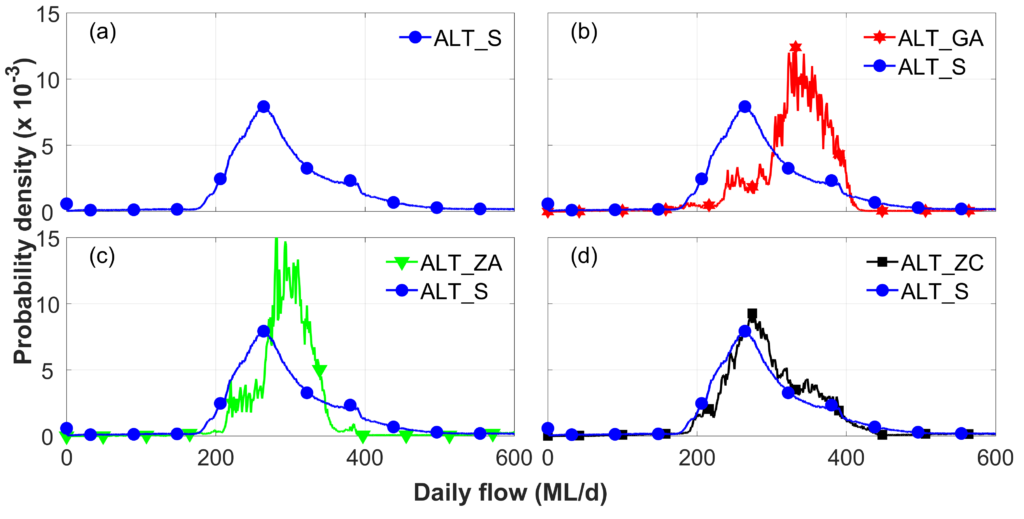
Impact of different average assumptions on water flows in distribution networks
Key Insights
It was found that average assumptions lead to material differences in model predictive behavior, and that the directions of these differences are unpredictable and sometimes lead to counter-intuitive outcomes. The application of average assumptions of any kind is problematic and has the potential to heavily influence infrastructure investment and, more broadly, policy direction. The use of average assumptions in assessment of distributed water solutions may provide an illusion of minimal benefits.
The authors are conducting an ongoing research program using bottom up systems analysis to evaluate the impact of average water demands across multiple cities, and the impacts that combinations of temporal and spatial averages have on water resource analysis. This research has presented new science insights and opportunities for understanding analysis of water resources. These insights are likely to apply to other disciplines.
Click here to access full paper from Australasian Journal of Water Resources