Influence of scales in urban areas
Australian cities operate at multiple linked temporal and spatial scales, from household to region, and are evolving to meet increasing challenges and opportunities. Population growth that is expanding the area of cities and an increasingly variable climate is driving higher costs of services. The services required by cities (such as water and energy) are mostly analysed and provided at a single centralised scale. This philosophy fosters provision of urban water services as essentially a transport industry that transfers water, wastewater and stormwater across increasingly long distances.
Solutions need to respond to the variability at the many different scales within cities. Nevertheless, centralised solutions are preferred and the benefits of local strategies such as water sensitive urban design (WSUD) are often contested. Evolving planning policies are also driven by infill development strategies that aim to protect prime agricultural land and avoid the costs of extending of water cycle services. A mindset of separate analysis of alternatives rather than evaluation of distributed solutions as part of a linked system results in missed opportunities.[1]
These issues are addressed by our ongoing peer reviewed research over the last 20 years and were presented at a WaterSensitiveSA workshop in December 2016. We incorporated all available Big Data from government agencies (such as Australian Bureau of Statistics (ABS), Bureau of Meteorology (BOM) and Office of the Chief Economist) and utilities in systems analysis to reveal historical benefits of local solutions. Ground truth provided by real projects in Perth, Newcastle and Melbourne confirmed the insights provided by historical data.
The response to the millennium drought demonstrated innovative approaches to increase local supply and reduce demand for grid water could improve the efficiency of the entire system.[2] Simple strategies such as rainwater tanks and reduced household consumption ensured that Australian cities did not run out of water. The reduction in residential mains water use per person over the last decade was derived from BOM data[3] and is demonstrated in the following graph for Sydney, Adelaide, Perth, Melbourne and South East Queensland (SEQ).
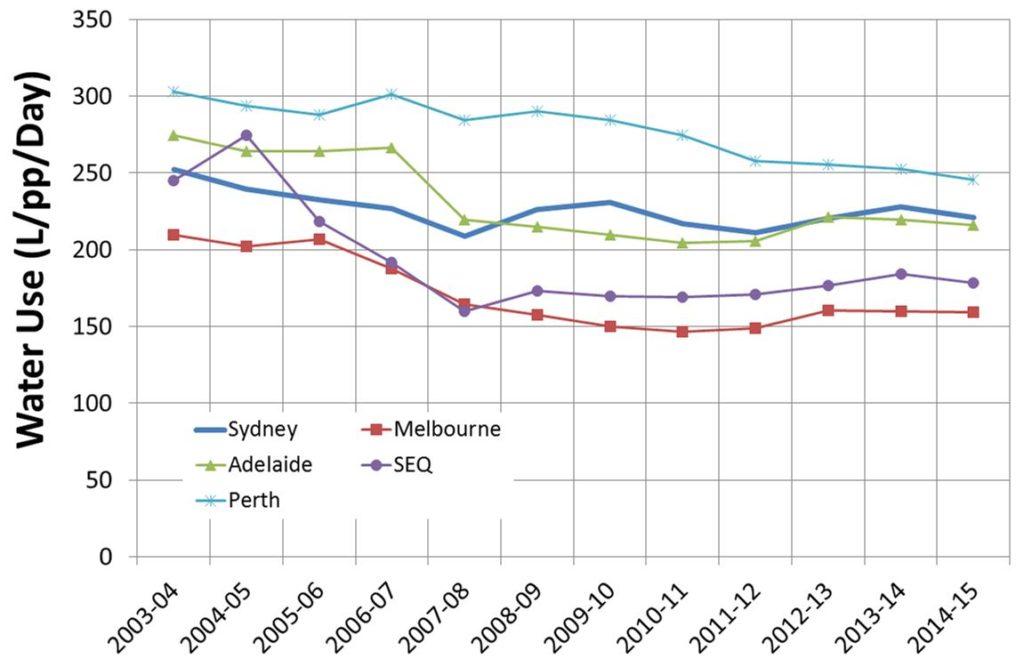
Figure 1: Residential mains water use in selected regions (derived from BOM data)
Although absolute comparisons of water use between cities is meaningless because the demographics, climate, land uses, property sizes and components of dwellings in each capital city are profoundly different – analysis using ABS[4] and water utility data within systems analysis[5] reveals that local solutions made a dramatic contribution to reducing potential growth in water demand in each region. Large scale wastewater and stormwater projects, and desalination plants and have been provided in these regions.
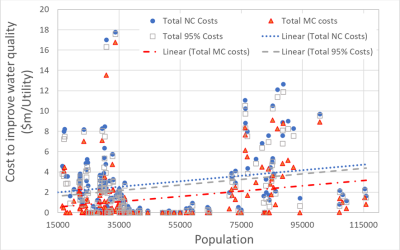
Key indicators of economic performance of the water sector are the impacts on household welfare and utility operating costs. National results for household expenditure on utility water services (Water Bill), water and sewerage services (Total Bill) and total mains water use (Water Use) was derived from BOM data and is shown in Figure 2.[6] This analysis does not include local government charges for stormwater management.
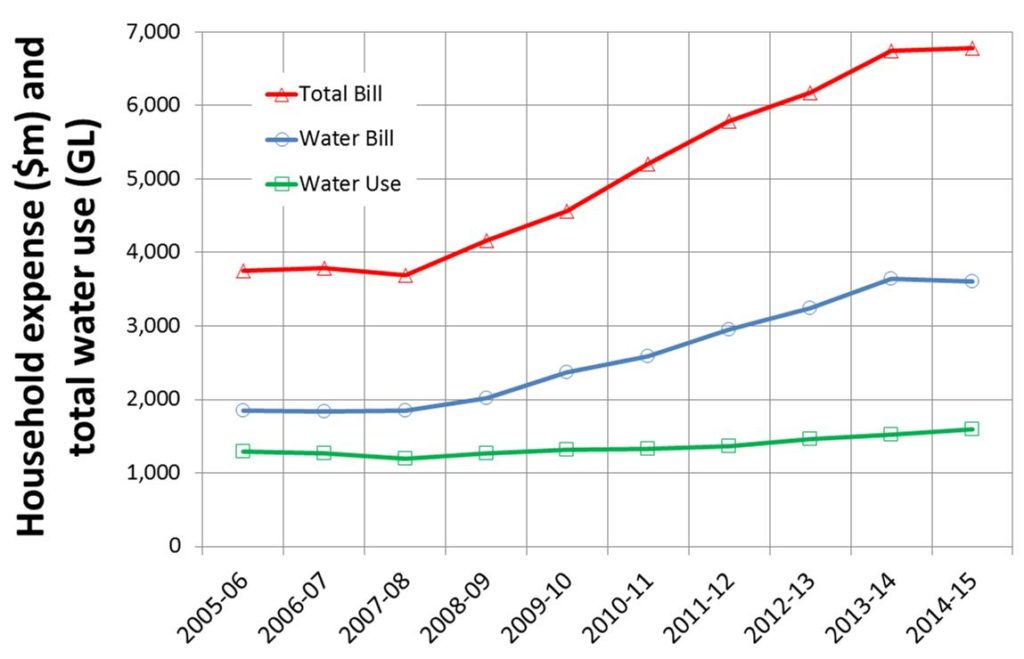
Figure 2: National household expenditure on utility water services and mains water use (derived from BOM data)
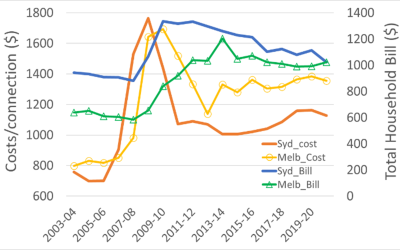
National household expenditure on water bills and total bills has increased by 95% and 83% over the last decade for a 23% increase in residential mains water use. There are similar declines in the efficiency of water utilities with associated reductions in household welfare in North America.[7] Similar impacts on household welfare are also experienced in the energy sector.[8] In Adelaide, household expenditure on water bills and total bills has increased by 98% and 184% for an 8% increase in residential use. Whilst increased costs of centralised solutions in response to many challenges, including drought and expanding cities, are expected – it is difficult to see that other supplementary solutions are not viable. The changes in water utility operating costs for Adelaide, SEQ, Sydney and for the average of all major utilities were derived from BOM data and utility annual reports and is shown in Figure 3.
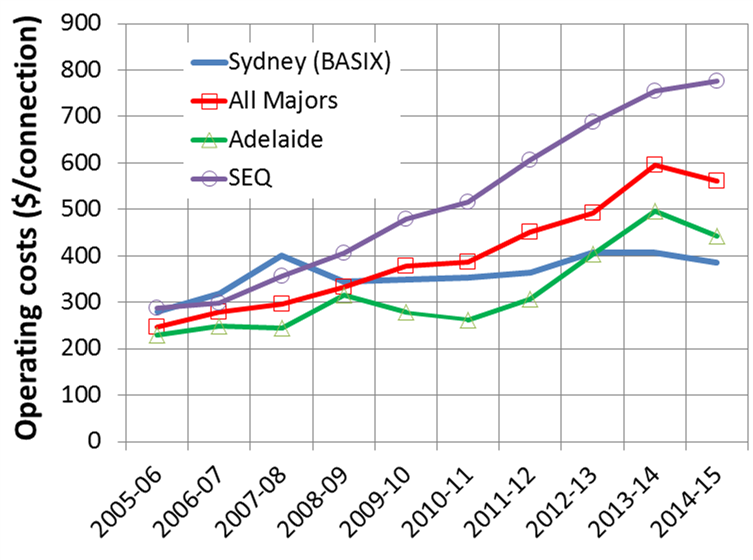
Figure 3: Utility operating costs (derived from BOM data and utility annual reports)
The utility operating costs of providing water services has increased by 169% for SEQ, an average of 127% for all major utilities and 93% for Adelaide. In contrast, utility water operating costs increased by 38% in Sydney. Systems analysis reveals the significant impact of dependence on large water grid infrastructure (long pipe transfers between regions) in SEQ that seems to be driving the highest growth in costs whilst the BASIX policy for sustainable buildings is driving the smaller increases in Utility costs.[9] BASIX is a state environmental planning policy that specified 40% reduction in water and energy use in comparison to regional benchmarks for residential buildings. It is supported by an online calculator and assessment process.
In the medium run (based on the last 15 years of economic data), increases in water costs (household expenditure and utility operating costs) in Adelaide were between 12 and 23 times more than increases in water use. Thus local water efficiency is a high value economic proposition due to greater reductions in utility operating, augmentation and security costs than any reduction in revenue[10] – this drives lower increases in water bills in the medium run as demonstrated for Sydney.[11] This result implies that each kilolitre of water saved at buildings is worth approximately 12 to 23 times the current household water prices provided that all costs are counted in the analysis.
The contribution of water efficient appliances and rainwater harvesting in each region that was derived using comprehensive data from BOM and BASIX in systems analysis is presented in Figure 4. The BASIX targets in Sydney are producing substantial water savings in comparison to the other regions that have optional programs or have ended programs for rainwater harvesting and water efficiency.
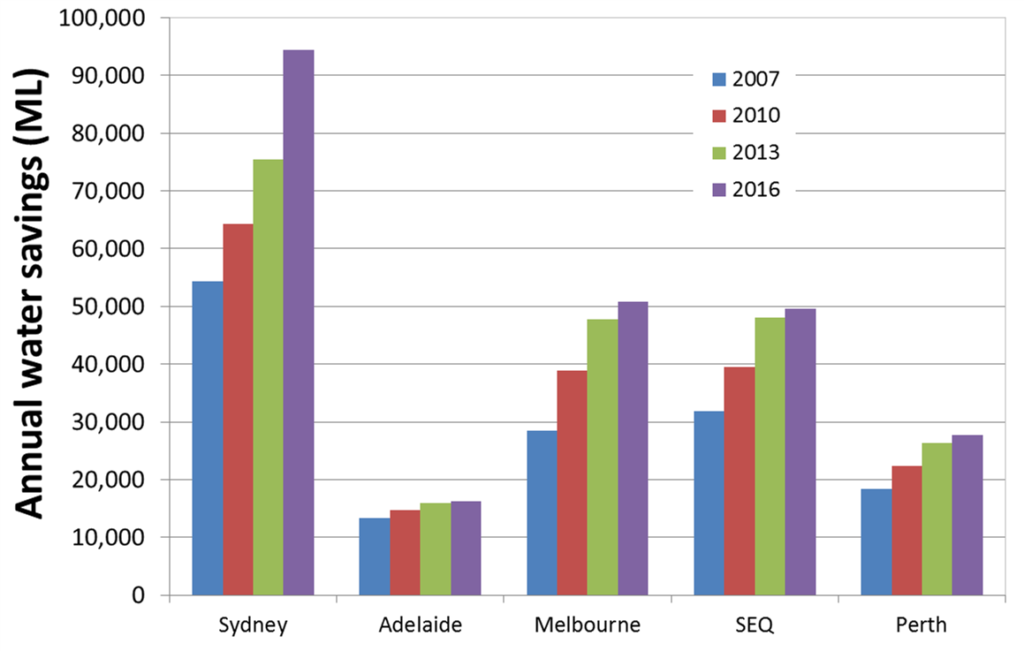
Figure 4: Total water savings produced by water efficient appliances and rainwater harvesting
This analysis suggests that the BASIX policy has provided in excess of $4 billion of cumulative benefits (water security, reduced utility operating costs, diminished impact on household affordability and diminished impacts on waterways) for the Sydney region.[12] This result from the data is consistent with results of our previous investigations using systems analysis.[13] We are mindful that these “hidden” benefits of existing local solutions apply to each region (as indicated in Figure 4). Additional whole of society benefits are also derived by creation of local employment and reduced impacts on waterways. A more general interpretation of these results is that local interventions such as WSUD approaches may have greater whole of system values than is currently understood.
The value of local solutions will be higher in the context of increasing density of urban areas and emerging Infill planning policies that aim to protect agricultural land and reduce infrastructure costs. A business as usual (BAU) approach to water services in an infill scenario is likely to experience greater impacts than expected.
Our systems analysis of Melbourne revealed that Infill planning strategies with BAU water management generated higher economic costs and environmental impacts. These costs were driven by the expense of upgrading existing infrastructure that will not have sufficient capacity to cope with higher density inputs. Infill policies with local solutions (sustainable buildings and WSUD) were found to supplement the capacity of existing infrastructure and cost less than BAU. A summary of this investigation can be found at: Ministerial Council Report and the original report can be downloaded from Report
However, these benefits are only available if local solutions are designed to reduced impacts and contribute to improved performance of the entire water cycle system. This does not mean that a local solution needs to meet all demands or solve all problems – but it does mean that local solutions mitigate part of the problem. In Sydney, the BASIX data shows that most rainwater tanks are connected to greater than 100 m2 of roof area and have capacities between 2,000 L and 5,000 L. Importantly, about 43% (ABS) to 78% (BASIX) of these rainwater harvesting systems are connected to multiple indoor uses. In combination with a target for reduced water use, these measures drive system wide benefits.
In contrast, Adelaide has a policy of 1,000 L rainwater tanks connected to one household water demand and data from ABS indicates that 29% of rainwater tanks in Adelaide are connected to indoor uses.
This article and our presentation to WaterSensitiveSA indicate that local solutions can supplement the performance of centralised water cycle systems to improve the economic performance of water utilities and households, and improve impacts on the environment. These benefits are greater in the context of increasing urban density and infill planning policies. However, clear performance targets for reduced water use and stormwater runoff from local solutions are needed to deliver this opportunity.
An example of the potential is demonstrated at the Fern Bay Estate (Fern Bay) that utilises cascading local solutions that are backed up by regional resources (see photo below). Although the estate does not have a formal pipe drainage network, its WSUD treatment train of rainwater tanks, infiltration, bio-retention swales, some minor pipe networks and defined overland flow paths has provided equivalent of better stormwater protection than traditional drainage for up to 1 in 100 year storm events during the last decade. The configuration and performance of the Renaissance Rise project (Renaissance Rise) is similar for clay soils.
1] ABS (2013) Environmental Issues: water use and conservation (Mar, 2013), Cat No. 4602.0.55.003: customised report.
[2] For example: Coombes P J (2005), Integrated Water Cycle Management: Analysis of Resource Security, Water, 32 21-26.
[3] Note that this article presented results based on typical water bills and our presentation was based on utility revenue for water supply to properties from the BOM.
[4] Coombes P.J., Smit M., and MacDonald G., (2016), Resolving boundary conditions in economic analysis of distributed solutions for water cycle management. Australian Journal of Water Resources, Vol 20, 11-29.
[5] Coombes P.J., Want, S., and Colegate, M., (2012). Development of Policies for Water Cycle Reform in Greater Melbourne and Sydney. Water and Climate – policy implementation challenges. Engineers Australia, Canberra.
[6] For example: BOM (2016) National performance report 2014–15: urban water utilities
[7] Mack EA., and Wrase S., A Burgeoning Crisis? A Nationwide Assessment of the Geography of Water Affordability in the United States, PLoS ONE 12(1) : e0169488. doi:10.1371/journal.pone.0169488
[8] Saddler H., (2016), Rising power bills signal the end of an era for Australia’s electricity grid. Article from Australian National University published in the Conversation, December 15.
[9] Ibid n4
[10] ibid n4
[11] Coombes P.J., (2017), Why the water supply needs a splash of competition, Australian Financial Review, 18 January
[12] Coombes P. J., Smit M., Byrne J., and Walsh C., (2016) Stormwater, waterway benefits and water resources benefits of water conservation measures for Australian cities. HWRS 2016, Engineers Australia, Queenstown, New Zealand.
[13] Coombes P.J., (2007). Energy and economic impacts of rainwater tanks on the operation of regional water systems. Australian Journal of Water Resources. 11(2), 177-191.